
KPI Catalogue Definition
Meta-Information
Origin: Hans-Michael Koegeler / AVL, Andrea Leitner / AVL
Written: April 2019
Purpose: Identification of “Key Performance Indicators” (KPIs), together with their relevant attributes (value ranges, probabilities) that are used in, e.g., V&V-pattern “KPI Model-based Validation”.
KPIs need to be defined in close consideration of the “Functional Scenario Definition” and finally will be part of the Scenario Database.
Context: Scenario Database and KPI Catalogue.
Pre-Conditions: availability of
– Function specification,
– Real world observations.
To consider: The output of this pattern is input to KPI-Models based Validation.
Used Terms/Concepts: (ENABLE-S3 scenario definition)
Functional Scenario: e.g. “Cut in”
Logical Scenario: e.g. “Cut in from left behind”
Concrete scenario (= concrete Maneuver): e.g. “Cut in from left behind, Starting_conditions defined”
(= optional subcategory for a functional scenario)
Observables:
“Type a”: KPI´s to assess performance of the automated functions
“Type b”: Variation Parameter (Starting_conditions) for concrete Maneuvers
Structure
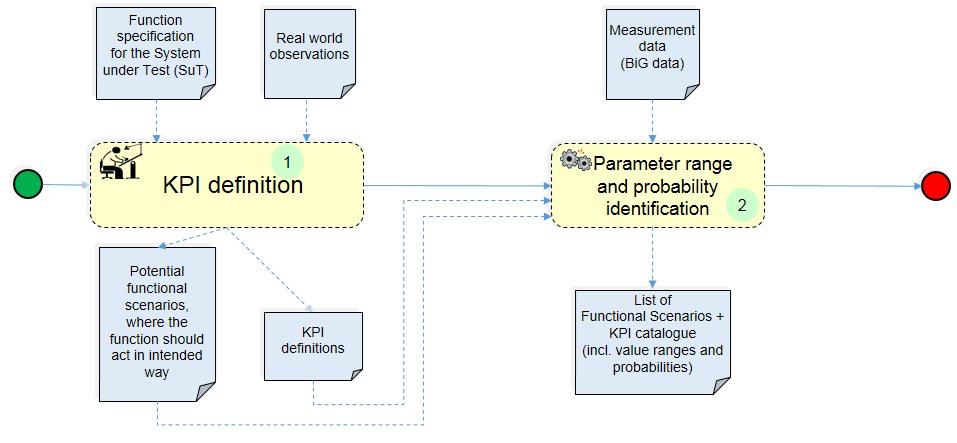
(1) KPI definition:
(2) Parameter range and probability identification:
Participants and Important Artefacts
V&V Engineer: The person responsible for executing this workflow. He is starting with the analysis of the Function specification of the SuT and it´s intended benefit – mainly considering potential safety risks. In particular he/she selects functional scenarios, based on real world observations and defines the KPIs and first expected target ranges in collaboration with Simulation/Test Engineer and the System Expert.
Simulation/Test Engineer: Responsible for setting up data access, evaluation procedures for the KPI calculations and the following maintenance of the automated evaluations.
System Expert: Person who has detailed knowledge about the SUT and the Function specification and its target benefits.
KPI catalogue definition: the inner loop of a bigger industrial release process to define SuT-specific, functional scenarios and their target observables in a typical KAIZEN process (continuous improvement):
KPIs of “type a” will define the output values to be kept, ensuring save operation”,
KPIs of “type b” will allow to recognize the appearance of the defined functional scenario in real world observations.
Data access and handling Software: User friendly data access, visualization and calculation capabilities and further, the later automation of the calculation rules has to support that process.
Function specification: Starting point is the specification of the final, intended benefit of the System under Test (SuT) and its Functions.
Potential functional scenarios, where the function should act in intended way: According to the intended function of the cyber physical system (SuT) several functional scenarios are related, where a certain behavior of the system is expected.
E.g.: Assuming an “Autonomous Emergency Braking System” (AEB), a typical functional scenario would be (according to Euro NCAP): Car-to-Car Rear Moving (CCRm) – a collision in which a vehicle travels forwards towards another vehicle that is travelling at constant speed and the frontal structure of the vehicle strikes the rear structure of the other.
Real world observations: Measurement results containing concrete examples for functional scenarios under consideration.
KPIs: Key perfomance indiators, which can be calculated according to a defined algorithm out of (real world) observations – always related to a certain SuT, functional/logical/concrete scenario, and observables. See Application Examples below for examples.
Actions/Collaborations
For all listed activities, usage hints are given under Application Examples below.
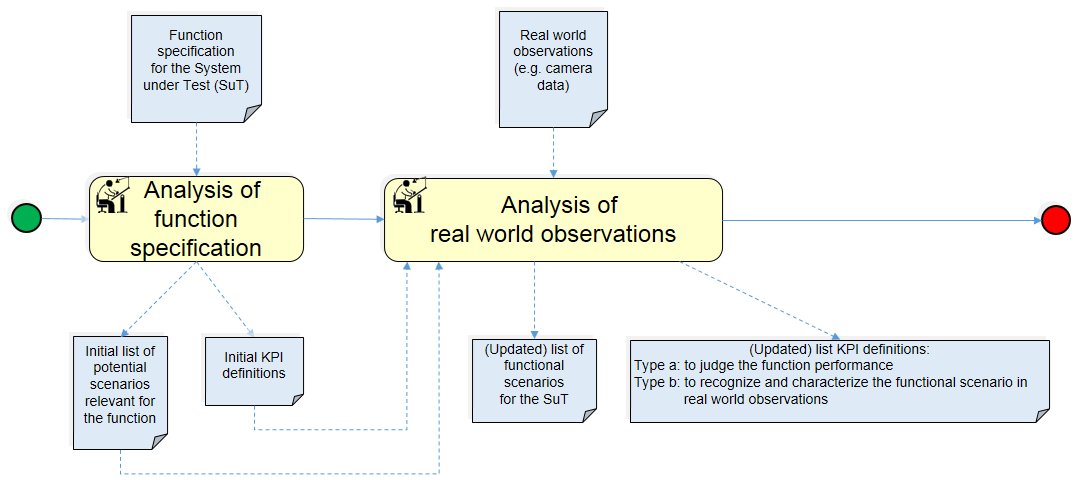
Analysis of function specification: Starting point is the Specification of the final, intended benefit of the System under Test (SuT) and its Functions. Out of that specification “Test cases” in form of “functional scenarios” and corresponding KPIs are derived, which have to be kept in an intended range.
Analysis of real world observations: Analyzing real world measurements will help to sharpen the theoretical concepts of risks to be avoided, when operating the SuT under daily life conditions. In particular, it will help sharpen further KPIs of “type a”, as well as derive new KPIs of “type b” (which characterize a functional scenario towards a concrete one).
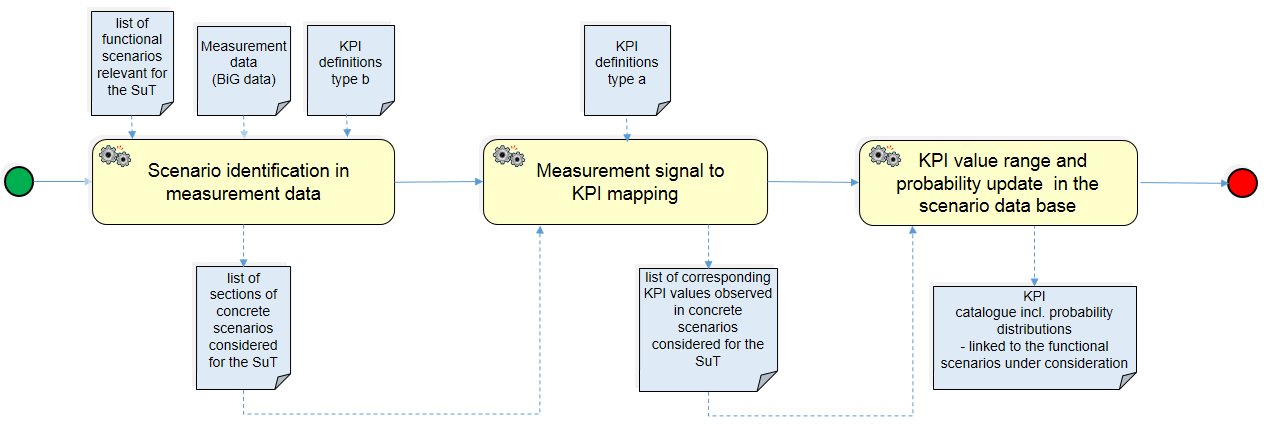
Scenario identification in measurement data: When using now the KPIs of type b, one can identify real world scenarios of the functional scenario under investigation in a larger scale of observations. The list of cut out sections of corresponding concrete scenarios is the input for the next step.
Measurement signal to KPI mapping: In this step for each concrete scenario the concrete values of the KPIs of type a is filled into the list of sections of concrete scenarios considered for the SuT.
KPI value range and probability update: Evaluating this list statistically allows to define probability distribution curves for both types of KPIs and the corresponding update of the scenario database. Thus the benchmark for a cyber physical system is defined to get better than the actual situation without the SuT.
Discussion
Benefits:
– KPIs are key, to get comparable results and to “measure the quality reached”.
– The KPI definition process itself is an abstraction of well known procedures, already exercised in practice (e.g.: EU-NCAP TEST PROTOCOL – AEB systems, Version 2.0.1 November 2017)
– The option to get even probability distribution curves in the suggested second step and systematically store the knowledge gained in scenario databases, will allow beyond the state of the art a quantification of the rest risk, using the “KPI-model based validation pattern.”
Limitations: This process needs continuous improvement and adaptation, as the real world scenarios are developing further. – So there exists a principle time delay between the status of the “picture of the real world” in the scenario database and the real “real world”
Comments: However, objective quality targets might be defined and the degree of fulfillment of this targets can be measured.
Application Example
For applications such as ENABLE-S3 Use Case 1 “Highway Pilot”, relevant artefacts and actions could be instantiated as follows:
For “KPI”:
SuT (System under Test), VuT (Vehicle under Test): e.g.: “Autonomous Emergency Braking System” (AEB)
Functional Scenario: e.g.: „Car to Rear (CCR)“
Logical Scenario: e.g.: „Car to Rear moving (CCRm)“ (= optional discrete subcategory for a functional scenario)
Concrete scenario (= concrete maneuver in this context), e.g.: „CCRm, velocity of Vehicle under Test (vVuT) = 30 km/h, velocity of Global Vehicle Target (vGVT) = 10 km/h, Lateral Overlap = 50%“
Observables:
“Type a”: KPI´s to assess performance of the automated functions: e.g.: Vimpact – means the speed at which the VuT hits the GVT
“Type b”: Variation Parameter (Starting conditions) for concrete Maneuvers: vVuT = 30 km/h, Lateral Overlap = 50% etc.
For Analysis of function specification: AEB should drop Vimpact to “0” km/h for any concrete form of CCR scenarios (besides other functional scenarios not mentioned in this example, as the procedure is analog).
For Analysis of real world observations: accident observations, special test measurements and/or daily trips, where emergency braking occurred.
Sharpen further KPIs of “type a”: e.g. not only judge Vimpact, but also the remaining distance after still stand (s_reserve) – which will get “negative” in case an impact had happened.
Derive KPIs of “type b”: (Starting conditions) for concrete Maneuvers: e.g. start_vVuT = 30 km/h, start_vGVT = 10 km/h etc.
For Scenario identification in measurement data: concrete form of CCR scenarios are identified with its concrete values for start_vVuT, start_vGVT, Lateral Overlap at impact.
For Measurement signal to KPI mapping: Vimpact, Time To Collision (TTC) after still stand.
For KPI value range and probability update:
for the functional scenario CCRm 95% of the start vVuT are between 6 and 37 km/h, 95% of start_vGVT are between 0 and 9 km/h and 95% of the s_reserve after still stand are between 5 and -3 m So the actual share of accidents out of the share of accidents out of the share of CCRm part of the total traffic will be known. This can be the base, to judge the contribution of improvement for the “Autonomous Emergency Braking System” (AEB) after testing it – in this functional scenario.
.
Relations to other Patterns
| Pattern Name | Relation* |
| KPI-Models based Validation | Applies the KPIs provided by this pattern |
| Abstract Scenario Mining | Can provide input for activity “Analysis of function specification“ |
| Runtime Monitoring | Can provide input “Measurement data“ |
* “this pattern” denotes the pattern described here, “that pattern” denotes the related pattern